Fleet Asset Lifecycle Management: From Acquisition to Disposal
- 1 day ago
- 6 min read
Fleet asset lifecycle management tracks every stage of a vehicle's operational life — from purchase through disposal. Here's what each stage involves and how to manage it well.
Every vehicle in your fleet goes through the same basic journey: you acquire it, put it to work, maintain it, and eventually replace it. What separates high-performing fleet operations from struggling ones isn't the journey itself — it's how deliberately that journey is managed at each stage.
Fleet asset lifecycle management is the practice of tracking, optimizing, and making deliberate decisions about vehicles and equipment across their full operational life. Done well, it means lower total costs, better uptime, more defensible replacement decisions, and a fleet that doesn't have surprises baked into its future budget.
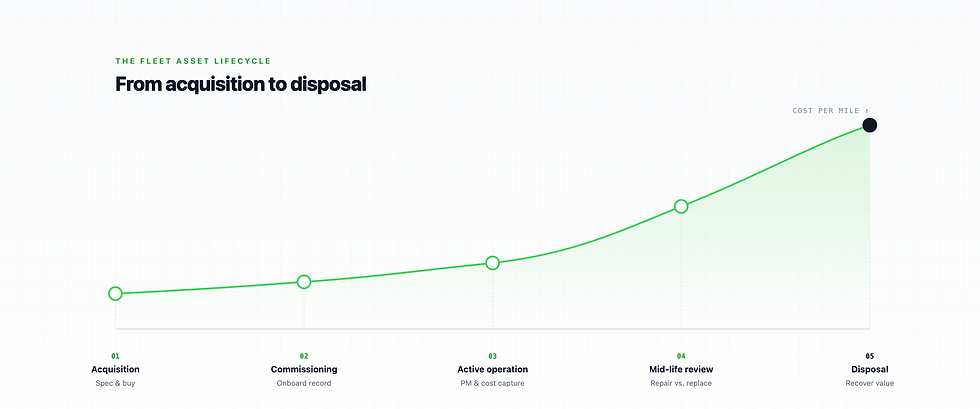
Here's what each stage of the lifecycle involves, and what good management looks like at each one.

01 Stage 1: Acquisition and Specification
The lifecycle begins before a vehicle ever turns a wheel in your service. Acquisition decisions — what to buy, when to buy it, and how to spec it — have cost implications that play out for the next five to fifteen years.
Common mistakes at this stage:

Over-speccing vehicles for the actual duty cycle - buying a heavy-duty truck for work that a medium-duty would handle, adding years of higher acquisition cost and fuel burn

Under-speccing because acquisition cost dominates the decision — buying cheaper vehicles that cost more to maintain and wear out faster

Replacing vehicles on a fixed schedule rather than based on actual condition and cost data
The data that should inform acquisition decisions comes from the vehicles you already have. Total cost of ownership by asset class, cost per mile trends over time, and maintenance spend acceleration as vehicles age — that's the information that turns acquisition from a budget conversation into a data-driven decision.
Most fleets don't have that data organized and accessible. That's the gap fleet asset management software is designed to close.
02 Stage 2: Commissioning and Onboarding
When a new vehicle arrives, the work of building its operational record begins. This is the stage most fleets underinvest in — and it creates data gaps that compound over the entire life of the asset.
A complete vehicle onboarding record should include:

Vehicle specifications
Make, model, year, VIN, engine type, transmission, GVWR, or specialty equipment

Purchase details
Acquisition cost, date of purchase or lease start, expected useful life, warranty terms

Initial meter reading
Confirmed odometer or engine hours at entry into service

Regulatory documents
Registration, title, insurance certificate, permits for any specialty configurations

Assigned PM schedule
Service intervals configured for this specific vehicle class and duty cycle from day one
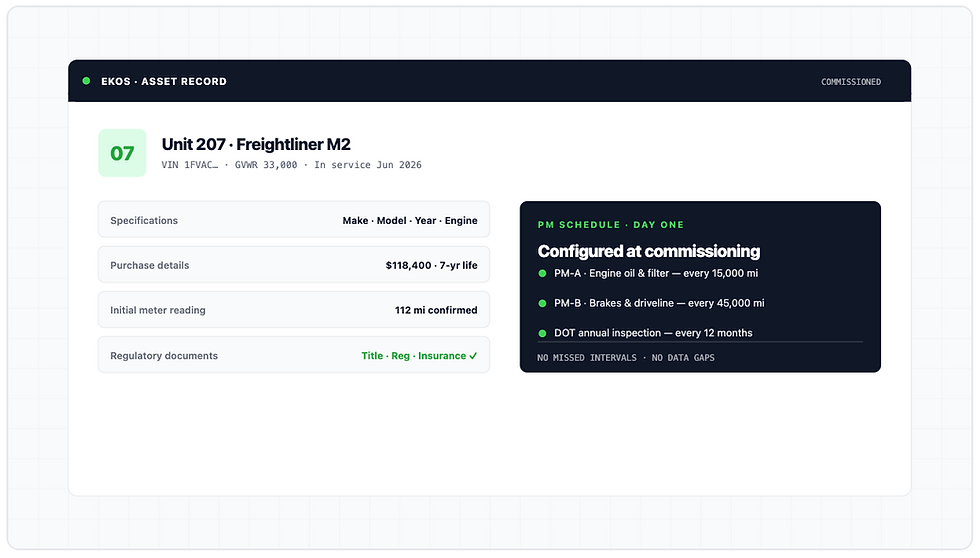
Setting up the PM schedule at commissioning — rather than waiting until the first service comes due — is one of the highest-value actions a fleet manager can take for a new asset. Every service interval that gets missed because the schedule wasn't configured is a data gap in the maintenance history and a cost risk going forward.
03 Stage 3: Active operation and ongoing maintenance
This is the longest stage of the lifecycle and where the quality of your asset management practice has the most direct impact on costs and uptime.
The core of active lifecycle management is preventive maintenance: scheduled services performed on time, based on accurate mileage and engine hour data, with every service recorded against the asset. Learn more about EKOS Preventive Maintenance.
In EKOS, odometer readings update automatically from Samsara, Geotab, and Teletrac Navman integrations — so PM schedules are always based on accurate mileage without manual entry. When a service comes due, the system generates a work order automatically. When the work order closes, the service history updates and the PM interval resets.
Beyond PM, active lifecycle management means tracking all cost events against the asset:

Fuel transactions, automatically linked from EKOS fuel site and fuel card data

All maintenance labor and parts costs, captured through work orders

Vendor repair charges, attached to work orders for outside shop work

Unplanned repairs and their root causes, tracked in the asset's issue history
This accumulated data is what makes every subsequent lifecycle decision defensible.
04 Stage 4: Mid-life review and the repair vs. replace decision
Every fleet asset reaches a point where the cost trajectory starts climbing. Repairs become more frequent. Unexpected failures replace predictable PM services. The cost per mile — or cost per engine hour — trends upward in a way that signals the vehicle is consuming more than it's worth.
The mid-life review is the deliberate practice of using accumulated cost data to evaluate whether a vehicle should continue in service, be repurposed to lower-intensity work, or be replaced.
The factors that should inform this decision:

Annual total cost of ownership compared to a replacement
If the current vehicle costs more to operate per year than a new replacement would cost to own and operate, the economics favor replacement

Maintenance cost acceleration
Is this year's maintenance spend higher than last year's? Is the gap growing? Accelerating maintenance costs are the clearest financial signal that an asset is aging out

Reliability and downtime
How many days per year is this vehicle unavailable due to repair? Downtime has a cost that doesn't appear in the maintenance budget but is real — covered routes, rented replacements, overtime for drivers

Remaining useful life
For certain asset types — school buses, utility trucks with specialized upfits — the cost of upfitting a new chassis may justify keeping a body that's still serviceable


"Accelerating maintenance costs are the clearest financial signal that an asset is aging out."
— Fleet Asset Lifecycle Management
None of this analysis is possible without a complete, accurate asset cost record. That's the argument for building the record carefully from acquisition forward — not retrofitting it when a replacement decision looms.
05 Stage 5: Decommissioning and Disposal
The final stage of the lifecycle is often treated as an afterthought, but it has real financial implications. How and when you decommission a vehicle — and what you recover from disposal — affects both the final TCO calculation and the acquisition budget for its replacement.
Disposal decisions typically fall into a few categories:

Sale at auction
The most common path for municipal and school district fleets, often through state-contracted auction services

Trade-in toward replacement
Common for dealer-purchased vehicles, though trade-in value is often lower than auction value for fleet vehicles

Surplus or inter-department transfer
Vehicles that are too worn for primary service may still be useful for lower-intensity applications within the organization

Parts salvage
For vehicles with major failures, stripping serviceable parts before disposal can recover some value
The timing of disposal matters. A vehicle's resale value declines faster in some market conditions than others, and the maintenance cost curve is not linear — costs tend to accelerate sharply once a vehicle passes a certain age or mileage threshold. Disposing of a vehicle before it hits that acceleration point typically yields better net economics than keeping it in service until it fails.
A complete asset record — with full maintenance history, documented mileage, and all service records — also supports higher auction or resale values, particularly for vehicles sold through competitive bid processes.
06 How fleet software supports each lifecycle stage

07 Frequently asked questions
What is fleet asset lifecycle management?
Fleet asset lifecycle management is the practice of tracking and optimizing vehicles and equipment from acquisition through disposal. It includes PM scheduling, cost tracking, mid-life review decisions, and disposal planning — all informed by a complete, accurate record of what each asset has cost and how it has been maintained.
When should you replace a fleet vehicle?
The optimal replacement point is when the total cost of keeping a vehicle in service exceeds the total cost of replacing it. In practice, this is signaled by accelerating maintenance costs, increasing downtime, and a rising cost-per-mile trend. Fleet management software makes this comparison visible by automatically tracking all cost components per asset.
How does fleet software help with lifecycle management?
Fleet software centralizes all asset data — specs, maintenance history, fuel costs, work orders, and documents — in one record per vehicle. It automates PM scheduling, captures costs automatically, and surfaces cost trends over time, giving fleet managers the data they need to make lifecycle decisions based on actual performance rather than assumptions.
THE BOTTOM LINE
Track every vehicle from commissioning through disposal
EKOS keeps specs, full maintenance history, real-time TCO, and PM scheduling all in one place. See how it works for your fleet.

MANAGE THE FULL LIFECYCLE IN ONE PLACE
See how EKOS tracks every asset
EKOS tracks every vehicle from commissioning through disposal — specs, full maintenance history, real-time TCO, and PM scheduling all in one place. See how it works for your fleet.


