How to Calculate Fleet Total Cost of Ownership (Step-by-Step Framework)
Most fleet TCO calculations leave out half the costs. Here's a step-by-step framework for calculating true total cost of ownership per vehicle — and using it to make smarter decisions.

Ask your finance team what a specific truck cost to operate last year and you'll probably get a maintenance figure. Ask your fleet manager and you'll get something that adds fuel. Rarely does anyone have the complete number — depreciation, financing, insurance, fuel, maintenance, tires, vendor repairs, and downtime — sitting in one place, calculated per vehicle, without a manual reconciliation project.
That gap between the cost you can see and the cost you're actually paying is where bad fleet decisions live. Vehicles stay in service too long. Acquisition budgets miss by significant margins. Vendors don't get held to the numbers they should be held to.
Here's a practical framework for calculating true fleet TCO — what to include, how to calculate it, and how to make it something your team can actually use.

01 What true fleet TCO actually includes
Total cost of ownership is the complete cost of operating a fleet asset over a defined period — typically one year or the full operational life. It's a broader number than most fleet managers track day-to-day, and most TCO calculations understate it because they leave out the categories that are harder to quantify.
A complete fleet TCO includes:
Fixed costs (incurred regardless of utilization)
Depreciation or lease payments
The vehicle's loss of value over time, or lease payment if applicable. For purchased vehicles, a straightforward calculation is: (purchase price − expected residual value) ÷ expected service life in years.
Financing
If the vehicle is financed, the annual interest cost belongs in TCO.
Insurance
Annual premium, allocated to the vehicle.
Registration, licensing, and permits
Annual fees including any oversize or overweight permits for specialty configurations.
Variable costs (scale with utilization)
Fuel
Total annual fuel consumption × average cost per gallon (or kWh for EVs). For fleets using EKOS fuel sites or fuel cards, this data is captured per vehicle automatically.
Routine maintenance
All scheduled PM services — oil changes, filters, belts, brakes, tire rotations — with associated labor and parts costs.
Unplanned repairs
Everything reactive, typically the most expensive maintenance category and the one most directly influenced by PM program quality.
Tires
A major consumable often tracked separately from maintenance. Full tire lifecycle cost should be included.
Vendor repairs
Charges from outside shops, including any towing or transport costs.

Indirect costs (often omitted but real)
Downtime cost
When a vehicle is unavailable due to repair, something covers the gap — a rented replacement, overtime hours, a route left uncovered. The cost is real even if it doesn't appear in the maintenance budget.
Administrative time
the hours spent scheduling maintenance, processing work orders, building reports, and managing records. Harder to quantify but worth acknowledging as a cost of manual fleet management.
02 Step-by-step TCO calculation
Here's how to calculate annual TCO for any vehicle in your fleet:

Gather annual fixed costs
Add depreciation (or lease payment) + insurance premium + registration and licensing fees + annual financing cost (principal × interest rate). This is your fixed cost baseline — it applies whether the vehicle operates 5,000 miles or 50,000 miles in the year.

Calculate annual fuel cost
Pull total fuel consumed from your fuel management system, fuel card transactions, or mileage-based estimates. Multiply gallons consumed × average cost per gallon. For fleets using EKOS, this pulls directly from fuel site and fuel card transaction data per vehicle.

Compile maintenance costs
Sum all work order costs for the year: labor, parts, and vendor charges. If work orders are tracked in a fleet management system, this is a report. If they're in spreadsheets or paper files, this becomes a manual reconciliation project.

Add tire costs
If tracked as a separate line item, add annual tire spend for the vehicle.

Add downtime cost if quantifiable
For operations where a down vehicle has a clear cost (a bus route not served, a delivery route uncovered), estimate the daily cost × average annual down days.

Sum all components
Total fixed costs + fuel + maintenance + tires + downtime = annual TCO.

Calculate cost per mile
Divide annual TCO by annual mileage. This is your most useful benchmark for comparing vehicles of similar classes and making replacement decisions.
03 A practical example
A medium-duty utility truck in a municipal fleet:

Now compare that to a newer equivalent truck with lower maintenance costs but higher depreciation. If the newer truck comes in at $1.05/mile all-in, the math on replacement is visible — it's not just a gut call about whether the old truck feels reliable enough.
04 Where most fleet TCO calculations break down
The most common failure mode is data living in too many places. Fuel costs are in a card portal. Maintenance costs are in a spreadsheet or a different software system. Vendor invoices are in email or a filing cabinet. Depreciation and financing are in accounting software that doesn't talk to fleet.

Building a complete TCO from these sources requires a monthly reconciliation project. Most fleet managers don't have time for it, so they work with partial numbers — and partial numbers produce partial decisions.
EKOS addresses this by pulling all cost components onto the same asset record:

Fuel transaction data flows in automatically from EKOS fuel sites and fuel cards

Maintenance costs are captured as work orders close — labor, parts, and vendor charges all itemized

Odometer readings update from Samsara, Geotab, and Teletrac Navman integrations, keeping mileage-based calculations current

All costs accumulate on the vehicle's record continuously, so TCO is always current without any manual assembly
For organizations that manage both fuel infrastructure and fleet maintenance — municipalities, school districts, fuel distributors — this unified picture is particularly valuable. EKOS Asset Management.
05 How to use TCO data to make better decisions
Repair-vs.-replace
The repair-vs.-replace decision is where TCO data has the most direct financial impact. When a vehicle needs a significant repair — a transmission, an engine, major bodywork — the instinct is to compare the repair cost to the vehicle's book value. That's the wrong comparison.
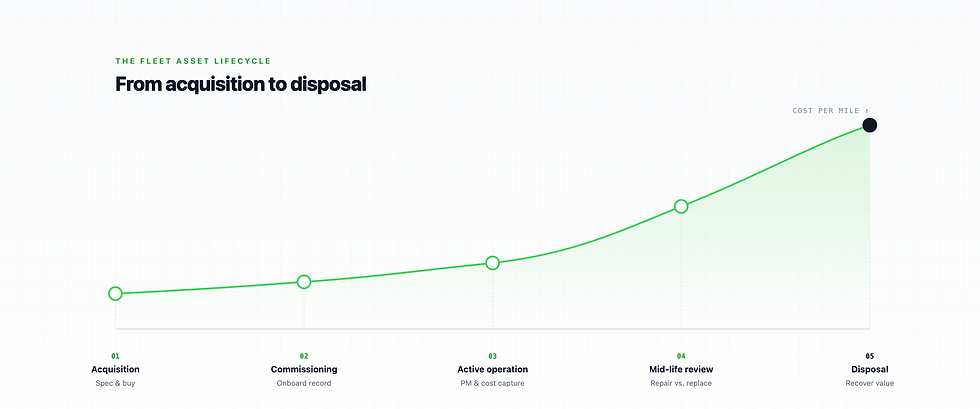
The right comparison: what will this vehicle cost to operate for the next three years if we repair it, vs. what will a replacement cost to operate over the same period? If the current vehicle's cost trajectory is climbing steeply and a replacement would bring that curve back down, the economics often favor replacement even when the repair cost seems manageable.

"Partial numbers produce partial decisions. A complete TCO turns a gut call into visible math."
— How to Calculate Fleet TCO
Budget planning
TCO by asset class gives fleet directors a defensible basis for annual budget requests. Instead of estimating maintenance and fuel separately based on prior-year actuals, you can project forward from cost-per-mile trends and expected utilization — and show the math behind the numbers.
Vendor negotiations
If you can show a vendor what their labor rates and parts pricing contribute to your per-vehicle TCO, you have a concrete basis for rate negotiations. Most vendors never see this data because most fleet operations don't have it organized.
06 Frequently asked questions
What is included in fleet total cost of ownership?
True fleet TCO includes depreciation or lease payments, financing, insurance, registration, fuel, routine maintenance, unplanned repairs, tires, vendor repair charges, and the cost of downtime. Most fleet managers track maintenance and fuel; adding the fixed cost components gives a complete operational picture.
How do you calculate cost per mile for a fleet vehicle?
Calculate annual TCO (all fixed and variable costs), then divide by annual miles driven. For example: $50,000 annual TCO ÷ 38,000 miles = $1.32/mile. This figure is most useful for comparing similar vehicles and tracking cost trends over time.
How does fleet management software help calculate TCO?
Fleet management software like EKOS captures all cost components automatically as they occur — fuel from fuel site and card transactions, maintenance from work orders, parts from inventory. Instead of a monthly reconciliation project, TCO is always current and available as a report per vehicle.
THE BOTTOM LINE
Know what every vehicle actually costs
EKOS automatically calculates total cost of ownership per vehicle - fuel, maintenance, parts, and vendor costs all on one asset record, always current. See it in action.

EVERY COST, ONE ASSET RECORD
See your real per-vehicle TCO
EKOS automatically calculates total cost of ownership per vehicle — fuel, maintenance, parts, and vendor costs all on one asset record, always current. See how it works for your fleet.