When to Repair vs. Replace a Fleet Vehicle: A Data-Driven Decision Framework
Repair or replace is the most consequential decision a fleet makes — and most fleets make it on gut feel. Here's a structured framework for getting it right, with the documentation to defend it.

A transmission fails on a truck that's eight years old and has 180,000 miles on it. The quote comes back at $7,400. Do you repair it or replace it?
Most fleet managers make this decision the same way: a rough mental calculation of repair cost vs. the vehicle's age, plus a gut feeling about whether this truck has been reliable. Sometimes the gut is right. Often it isn't — because the gut doesn't know what the vehicle actually costs to operate, or how that number has been trending.
This framework replaces the gut check with a structured, data-driven approach that gives you a defensible answer — and the documentation to explain it to anyone who questions the decision.

01 Why the standard repair vs. replace formula doesn't work
The most commonly cited rule of thumb is: if the repair cost exceeds 50% of the vehicle's current market value, replace it. It's simple, widely used, and consistently wrong.
The problem is that it compares the wrong things. A single repair cost tells you nothing about the vehicle's cost trajectory, its likely reliability going forward, or what a replacement would actually cost to operate. A vehicle with a $4,000 repair bill might be in the early stage of a cost acceleration curve that will produce $12,000 in repairs over the next 18 months. Or it might be an isolated event on an otherwise well-maintained, low-cost asset.
Without historical cost data, you can't tell the difference. With it, the answer is usually obvious.
02 The data that actually predicts the right decision
Annual total cost of ownership trend
Pull the vehicle's total operating cost — fuel, maintenance, parts, vendor repairs — for each of the past three years. Is the number flat, trending slightly up, or accelerating sharply? A vehicle whose annual operating cost has gone from $18,000 to $22,000 to $31,000 over three years is showing you something clear. One whose cost has been $19,000–$21,000 for the same period tells a different story.
TCO trend is the single most predictive signal in the repair-vs.-replace decision. EKOS tracks this automatically per vehicle as fuel costs, work orders, and vendor repairs accumulate on the asset record over time. EKOS Asset Management.

Cost per mile (or cost per hour) trajectory
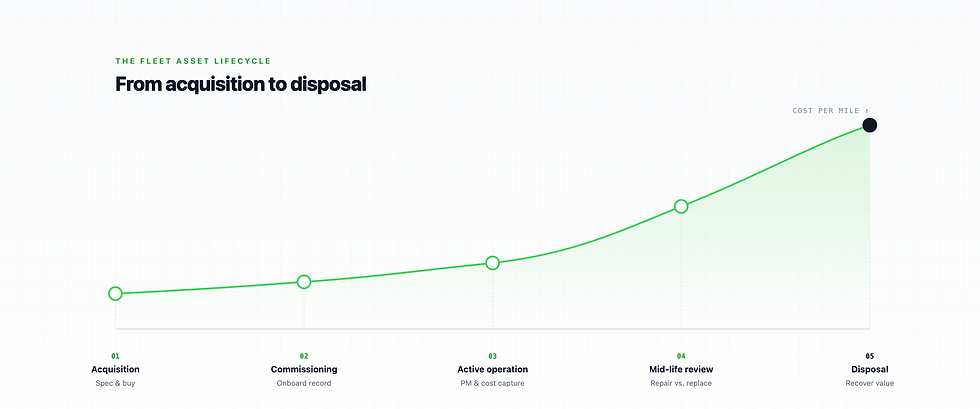
For vehicles with varying utilization levels, cost per mile normalizes the comparison. A vehicle driving 45,000 miles per year and spending $40,000 in operating costs is performing at $0.89/mile. The same vehicle at $60,000 in costs is at $1.33/mile — a signal worth investigating. EKOS Reporting.
Maintenance cost as a percentage of vehicle value
As a vehicle ages, its market value declines while maintenance costs tend to rise. When annual maintenance spend reaches 25–30% of the vehicle's current market value, the economics of continued operation become increasingly difficult to justify — particularly if other indicators are also pointing toward replacement.
Reliability and downtime days
A vehicle that spends 30 days per year unavailable due to repair has a downtime cost that doesn't appear in the maintenance budget. For a school bus that means 30 days of route disruption. For a utility truck, it means covered work or rented equipment. Tracking downtime days per vehicle per year — a metric EKOS captures through work order open-to-close dates — gives you a concrete productivity metric alongside the financial one.
Root cause of the repair in question
Not all large repairs signal the same thing. A $7,400 transmission failure on a vehicle with otherwise clean maintenance history and a flat cost trend might be an isolated event — replace the transmission and continue operating. The same repair on a vehicle with accelerating costs and three unplanned repairs in the past 12 months is telling you something different.
Context matters. The repair cost is just the trigger for the analysis — not the analysis itself.
03 A practical repair-vs.-replace framework
When a significant repair comes in, run through these five questions before approving or declining:

What is this vehicle's annual TCO trend over the past three years? Flat, rising slowly, or accelerating?

What is the cost per mile trend over the same period?

If we make this repair, what is our realistic forecast for annual operating costs for the next 12–24 months?

What would a replacement cost to acquire and operate over the same period — all-in, including depreciation, fuel, and expected maintenance?

What is this vehicle's current downtime rate, and is that rate increasing?
If the answers to questions 1, 2, and 5 are pointing in the same direction — costs climbing, downtime rising — and the repair doesn't materially change that trajectory, replacement is likely the right call. If the vehicle has been reliable and this repair is an outlier, continued service usually makes sense.
The framework doesn't require a spreadsheet model. It requires having the historical cost data available and being willing to look at it before making the call.
04 Special considerations for municipal and school district fleets
Public sector fleets operate under constraints that make the repair-vs.-replace decision more complex:

Procurement timelines
Replacing a vehicle in a municipal fleet often requires a budget cycle, a bid process, and a delivery lead time measured in months. Replacement decisions need to be made well before the vehicle fails — which requires proactive monitoring of cost trends rather than reactive responses to failures.

Auction and surplus requirements
Public sector vehicles are typically disposed of through regulated surplus or auction processes. The vehicle's maintenance record and documentation quality directly affect auction outcomes.

Upfit and specialty configurations
A school bus body that's still serviceable may justify a chassis replacement rather than a full vehicle replacement. A specialty utility upfit may be worth preserving on a new chassis. These decisions require knowing what the upfit is actually worth and what a replacement chassis would cost.

Fleet age distribution
A common trap for public sector fleets is allowing the entire fleet to age simultaneously — resulting in multiple replacement decisions hitting the budget in the same year. Monitoring age distribution and staggering replacements proactively avoids budget spikes.
05 What good data makes possible
The repair-vs.-replace decision improves dramatically when it's made with complete cost history rather than a single repair quote. Fleets with accurate per-vehicle TCO data can make these decisions faster, with more confidence, and with documentation that withstands scrutiny from finance departments and governing boards.
The barrier isn't usually the analysis — it's having the data organized. That's what fleet asset management software is designed to solve: not just recording costs as they happen, but surfacing the trends that make decisions like this straightforward rather than stressful.
06 Frequently asked questions
When should you replace a fleet vehicle?
When the total cost of continued operation — factoring in fuel, maintenance, downtime, and cost trajectory — exceeds the total cost of replacement over the same period. This calculation requires accurate per-vehicle cost history, which is why fleet management software is essential for making these decisions well.
How do you calculate if a repair is worth it?
Compare the repair cost to the vehicle's cost trajectory, not just its current market value. If annual operating costs have been accelerating and the repair doesn't address the underlying cause, replacement often has better long-term economics. If the vehicle has been reliable and the repair is an isolated event, continued service usually makes sense.
How do municipalities decide when to replace fleet vehicles?
Most municipalities use a combination of age, mileage, maintenance cost thresholds, and condition scoring. The challenge is that procurement timelines are long, so replacement decisions need to be made proactively — which requires monitoring cost trends continuously rather than responding when a vehicle fails.
THE BOTTOM LINE
Decide with the history, not the quote.
EKOS surfaces maintenance cost trends, cost per mile, and downtime data per vehicle automatically - so repair vs. replace decisions are based on complete history, not guesswork.

ONE PLATFORM, FUEL AND FLEET
Make the next repair vs. replace call with data
Request a walkthrough tailored to your fleet size and industry, and bring the vehicle you're unsure about. EKOS offers a 30-day full-access trial so you can run the five questions against your actual fleet history.